~ Knowledge is embodied in people gathered in communities and networks. The road to knowledge is via people, conversations, connections and relationships. Knowledge surfaces through dialog, all knowledge is socially mediated and access to knowledge is by connecting to people that know or know who to contact. ~ by someone I don't know (just being honest)

While exploring different tools in Adobe Omniture Suite, I am finding a new piece of information everyday which I'd like to share with you all. Hope you all find these informative and don't hestitate to pass your invaluable feedback. Enjoy!!!!

Saturday 3 December 2011

Additive Segments - creating complex segments

Today I'll discuss how we can save some time by creating Additive segments, another cool Discover feature which many of us do not know about.

We all love segments and why not, these allow us to find those golden nuggets from the heap of data. Discover is kind enough for allowing us to create as many segments as we can but if you are a frequent Discover user who's involved in advanced analytics, you may find yourself with too many segments. One of the reasons that leads to this situation is creating complex segments which could be created by simply merging 2 or more modular segments.

For example, you need number of visits to your shop server when customers used mobile devices.  You have a segment for Shop server visits and another for mobile visits but if you do not know about Additive segments, you may end up with a new segment which fulfils both conditions.

Creating Additive segments is not-that-well-known feature of Discover where you can use multiple existing modular segments to create new complex segments, rather than starting from scratch.

There are 3 ways to create Additive segments:
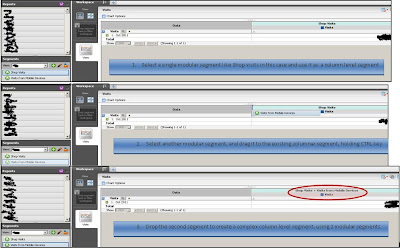
1. use CTRL key to select multiple segments from the Segments panel and drag them together
2. If you already have a workspace, select the segment to be added using CTRL Key and drag to the workspace.
3. If you are applying a column level segment, use CTRL key while dragging an already created segment and drop it over column.

  Image 1: Select multiple segments using CTRL key
                                                                  

Image 2: Creating Workspace level complex Segments using Additive segments

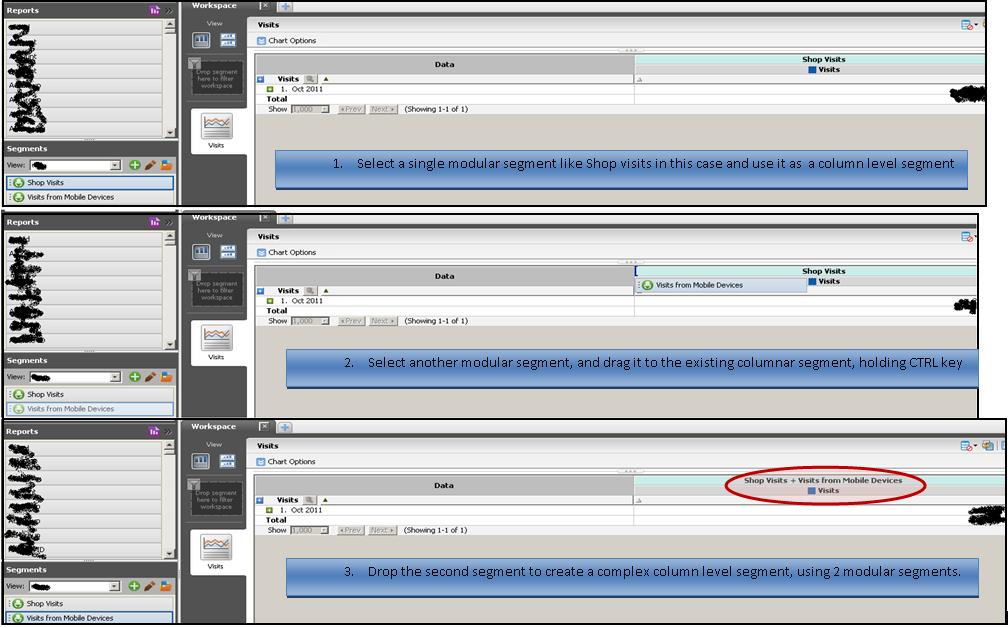
Image 3: Creating Column level complex Segments using Additive segments

Additive segments is a cool feature which helps you by:
1. Saving time in creating new complex segments
2. Simplifying segments creation as now you need just modular segments and create complex ones on the fly
3. Making segment management easy by keeping the number of segments manageable

Hope you'll like and use this tip!!!

Wednesday 2 November 2011

Trending multiple cells in Discover

Welcome back Rajneesh!!! I heard my soul stating this on my return after one year. All this time, I was still learning, waiting for this day when I can again start share more. I hope I may maintain the momentum this time so keep providing your valuable feedback.

First of all, many thanks to my friend Andrew Wathen for providing initial tips to kick-off this second inning.


 So, everyone loves trends and so do Discover users. We many times simply hover on the cell we want to trend and click on that tiny image to see the trend which looks like below:


Now clicking on Launch Trend Report button opens another report with all dates in the report range on left and metric values corresponding to the selected cell on right, for the selected dimension value.

 
What if you need to do some calculations on the basis of trends against multiple metrics? I used to trend individual cells, launch the trended report, copy data and paste it in a spreadsheet program like Excel and then do necessary calculations. This can take good amount of time if you have many cells to do calculations on.

A really simple tip (not sure how I missed it, you should not as you just read this article) is pressing Ctrl key and select multiple cells, right click on one of the selected cells and select option Trend Cells (you will note if you are careful that option says Cells, not Cell!). The result is each metric being trended for the selected dimension value. You can also select multiple dimension values which means more number of columns in the new trended report.

Now how this cool feature be useful:
1. Trended comparison view of multiple dimension values. For example, if you want to see Visits and Exits to Homepage and Registration page over a period of time, add these 2 metrics, select both pages in the Pages report and use Trend cells which will contain 4 columns, each for combination of a page and a metric.

2. Most of the Discover users must be facing issues in trending calculated metrics over time because of a Discover defect. As a result of this, your favorite metrics like Bounce rate against a page, when trended, show irrelevant data (if you haven't tried this, give this a go). I haven't found any solution to this defect but a close workaround is to select the metrics used in the calculated metric rather than calculated metric itself and use Trend cells feature to get the data which you can copy and paste in an Excel sheet and then run calculations. Most of the times, you'd just need to apply the formula in top row and drag it to apply on  all.

Hope this saves some of your precious time...

Sunday 31 October 2010

How to get trended data for a Fallout report? | Discover

Hi again all!!! So where had I been for so long?? No, I didn't go for an oil search expedition in Siberia :). Well, there were more than a couple of good news and I was busy celebrating those but I am back now and will keep my audience busy!!!


So today's question now. I faced an interesting challenge last week when I needed to get daily data for my favourite fallout report for last 6 months. Earlier, I used to get data for every day and put it manually in Excel however this time time-period was too long to do this exercise manually. So is there an easy way to get a trended view of a fallout report in Discover.

My quest led me to one very less frequently used feature of Discover 'Copy report data'. Normally, we tend to schedule reports so this was something I had never used but believe me this is a very handy feature and I am more than ever before.


All you need to do is, select the time-period (in my case I selected last 6 months) and run the fallout report. Once all data is there, click on 'Copy report data' button in the toolbar. This copies data in clipboard which you can copy to an Excel sheet.

When you copy the data in an Excel sheet, you'll see data has 3 parts:


First part of the copied Discover report will show data of Fallout report for all period you selected. In other words, it converts Discover fallout report into a tabular for. That's it.


Second part of the copied data shows for each checkpoint (or page) of the fallout report, where customers went to and lost (Fall-out) and where customers went but still were part of the funnel (Fall-through). Confusing? A little I know...
Imagine we have a fallout report for a checkout journey. This journey start with Your Cart page and end on Order Confirmed page. Now there will be other pages between these 2 pages like Personal Details, Payment details etc. but these are not part of our fallout report.
Now, if a customers goes to Personal details page from Your Cart page but doesn't complete order, this will be a Fall-out against Personal details page.
However, if a customer jumps back to your Homepage from Your cart page, does some more research and completes order, this will a Fall-through for Homepage.


Now third part of data is what we were looking for! It breaks up data by day, visits against each checkpoint and corresponding conversion rates. Time-saving, isn't it??

Hope you find this article informative and as always, please let me know your feedback. Good night :)

Monday 27 September 2010

Page Depth Report and Average Page Depth Metric and Confusion | SiteCatalyst and Discover

Nice weekend, good news on second one from team clearing ACP - SiteCatalyst certification (congrats Deepak)! The day is hopefully not far when whole team will be able to state "Adobe certified professional" in their email signature, Amen!!!!


Back to work :)

While discussing bits that confuse the most in Omniture, one thing that popped up in a conversation was Page depth. Lets try to understand these and raise your hands if you don't!

Page Depth report is a REPORT, under Paths > Pages > Page Analysis, which tells you how many times a certain number of pages are visited before an 'event' occurs. Rows in the report denotes number of pages and figures against metrics tell you 'how many times'. So, if you choose Orders as a metric then row with 10 pages  tell you how many times 10 pages were visited before an order was completed on your site. See a screen-shot of this report:


Please note that these pages are visited, not viewed so reloads are not counted.

What happens when you choose Visits metric for this report? This report, when uses Visits metric, works exactly same as Path length report i.e. it tells you the length of a visit which is same as how many pages were visited before a visit completed.


What this report means to me?: This report can be used to understand following user behaviour on your site:
1. Are more visitors visiting just 1 or 2 pages? If yes, which ones (use correlations for this)?
2. Normally registration on my site takes 5 steps. That's what you think! Report will help you what your visitors think. Exploring longer paths than expected will help you in optimizing your favourite journey. Assignment for you all if you can tell how this can be done (Hint: Discover by yourself!)
3. One interesting bit that I found was using this report to figure out how many visitors bookmark an order completion page and return back to check the order-details. This is my own finding, would love to understand how you use this report or others we discuss on this blog.


This makes sense now, doesn't it?


Now lets look at Average Page Depth, which is a METRIC. This metric is available in Pages report and is associated with a page. I need not say, this is completely different from Page Depth which is a report. 


What is Average Page depth? This tells you how deep a page lies within a visit. For instance, if your visit is:
Page A > Page B > Page C > Page D
then for this particular visit, SiteCatalyst gives Page A depth value as 0 (zero), Page B will have page depth as 1 and so on. Page D will have page depth as 4. Ohh come'on Raj, stop kidding.


I was not kidding, or may be I was being me :). For SiteCatalyst, page depth of Page D will be 3, but Discover starts its page depth counting from 1 and that's why Page D will have page depth as 4 in Discover (I was not kidding!).


So why do they use word Average? Good question! In most of the cases, a page will be part of multiple visits i.e. a page was viewed in more than one visits. Now Adobe cannot show you page depth of a page for all the visits (can they?), so they take average of page depths of all occurrence for the page.


What happens if a page is visited more than once in a visit? For instance, what if scenario is like this:
Page A > Page B > Page B > Page C > Page D > Page B


Discover counts first instance of the page as its page depth and ignores others in the same visits. SiteCatayst counts every instance. Page depth in both these systems will be like this:


                         Page A > Page B > Page B > Page C > Page D > Page B
Discover:                1             2               -            3              4            -
SiteCatalyst:           0            1              2             3             4              5 


So in Discover, Page B will have Average page depth 2
while in SiteCatalyst this will be: (1+2+5)/3 = 2.67


In SiteCatalyst, some pages may have Average page depth less than 1. These pages are normally landing pages of your site and as landing pages have page depth 0, the average may end up being less than 1.


Phewww!!!! 


Why should I use this metric for? This metric can be used in 2 ways:
1. To find whether visitors are returning back to your landing pages, which can be identified if landing pages have high average page depth - in SiteCatalyst
2. To find which pages are acting as landing pages - pages with Average page depth as 1 in Discover


Will love to see your questions/comments on this one


-------------------------------------------------------------------------------------------------------
                VERY VERY IMPORTANT NOTE
-------------------------------------------------------------------------------------------------------
After release of SiteCatalyst 14.9 and Discover 2.95, Adobe has made changes in Discover to behave exactly as SiteCatalyst to calculate Average Page depth!
------------------------------------------------------------------------------------------------------- 

Wednesday 22 September 2010

Top Domains vs Domains report | SiteCatalyst

Last night when this question got raised, honestly, no one out of us three (me, Deepak and Aashima) had a clear answer. And when we found what's the difference between these two, not that commonly known and used reports, under SiteCatalyst User Profile sub-menu, I thought its worth sharing on this blog.

So let's first understand what are domains. Domains are simply ISPs (Internet Service Providers). These are taken from the user-agent string when SiteCatalyst code is executed on your site. None in this report signifies that user-browser sent just an IP address. See an example below:


So, in simple terms, Domains report tells you what ISP providers your site visitors are subscbied to.

Domains report is also different from Referring Domains report which lists which sites visitors use just before landing on your site e.g. google.com.

Top Domains? Present ma'm !!! :-) What do you do?

Top Domains report tells about which country your visitors are visting your site from. Deah... Omniture is duplicating their reports... isn't it same as Countries report under Geosegmentation, does that not tell me the same?

Well, that doesn't. While Countries report is based on visitor's IP address, Top Domains report uses ISP address to identify where visitor was surfing your site from. And results are different!

Countries (and other GeoSegmentation reports) report gets the IP address of the vistor, looks into the database of  DigitalEnvoy (partner of Adobe) and then attributes metrics to matched entry.
Top Domains reports goes through entreis in Domains report, looks at the ISP URL, gets the country out of it e.g. .uk for United Kingdom, .in for India and puts the metrics against listed countries. See example below:

Generic domains like .com (Commercial), .net (Network) and .org (Organization) are attributed to United States.

If you check both images closely, first metric against None in Domains report is same as IP Address Only value in Top Domains (trust me, I don't make up these numbers!)

Hope it was useful, and yes before I switch the lights,  thanks to my friends :)

Monday 20 September 2010

Daily Unique Visitors more than Daily Visits? Is it possible? | SiteCatalyst & Discover

Good break guys??? Well I'll try to cover more than a couple of things today to discuss topics which are really important to understand how SiteCatalyst collects data.

So the initial question I am trying to answer here is how come my SiteCatalyst is showing me count of daily visitors more than visits for a particular day? Is there any implementation problem or do I need to see an optician?

Before this, we need to understand how SiteCatalyst determines a visitor. SiteCatalyst uses following 2 mechanisms to determine a unique visitor :
1. Primary method is using persistent cookie on user's browser.
2. If a visitor has disabled disabled cookies or his/her browser doesn't support persistent cookies then SiteCatalyst uses combination of IP address and user agent string.

Discover determines a unique visitor in the same way as SiteCatalyst does.

Now the interesting fact, SiteCatalyst doesn't track a visit if it's on a system that doesn't support persistent cookies. However, Discover does. This is an important fact you should remember in case you need to answer a query on difference between visits reported in SiteCatalyst and Discover.

So what? My question..my question...my question...., hold on, haven't I answered this already? If more" No -cookies" customers visit your site, then they'll be counted in unique visitors (using IP address and user agent sting) but will not contribute in Visits metric of SiteCatalyst.

PathViews is another metric where SiteCatalyst will not report if visitor has cookies disbaled or persistent cookies are not accepted. Discover will do.

What we learnt today:
1. How Omniture tracks unique visitors?
2. Exception rules for SiteCatalyst visit tracking
3. Some more differences between Discover and SiteCatalyst
4. How to crack bad jokes like this 4th point

Summary:


Cookies accepted
Cookies not accepted
SiteCatalyst
PageViews – Yes
PathViews - Yes
Visits – Yes
Visitors – Yes
PageViews – Yes
PathViews – No
Visits – No
Visitors – Yes
Discover
PageViews – Yes
PathViews - Yes
Visits – Yes
Visitors – Yes
PageViews – Yes
PathViews – Yes
Visits – Yes
Visitors – Yes


Thursday 16 September 2010

Bounce Rate - SiteCatalyst vs Discover

Have you tried calculating Bounce Rate both in Site-Catalyst and Discover and wondered why the two are different for a same page?
This brings another interesting fact, SiteCatalyst provides Single Access Visits but Discover has Single Page Visits. Did you notice the difference? Yes, its Access vs Page. So are these 2 metrics different?
Difference is a little more than just metric labelling, as I explain below:

Discover defines a single page visit as a visit where only one server-call being made by the visitor....while SiteCatalyst considers a single access as only one page being visited..... ahhh please clarify more.

It is possible to visit only a single page but still have multiple server-calls if:
  •  page is reloaded
  • AJAX calls on page which are Omniture tracked
Therefore if a page is reloaded or an AJAX call is made on a page in a visit and if this is the only visited page, this will not appear in Discover un Single Page Visit but in SiteCatalyst it will have its Single Access Visits counted incremented by 1.

So as a result, Discover may have lower number of Single Page visits than SiteCatalyst and hence lower bounce rate for a single page.

So what should we use? Good question (yeah, asking questions is good), I suggest using SiteCatalyst as its Single Access visit is closer to definition of a bounced visit by WAA : -For a bounced visit, the entry page and exit page are the same page. Discover, even if a same page is entry and exit page, will not consider it a bounced visit because of reasons explained above.

How to exclude yourself from being tracked in SiteCatalyst

What if you want to exclude yourself being counted as a visitor when you access your site? This surely skews stats as you keep checking your site regularly (if you are truly into Web-Analytics). One, a comparably difficult to implement but easy to maintain solution is to use VISTA rules to exclude all IPs which you think are skewing your results.
So tell me something simpler then!!!!
Make use of Exclude by IP option in Admin dropdown. This option allows you to exclude your IP address or your machine by cookie. My preference is cookie unless you hate them :) 

Now some limitation; this setting will exclude only your machine. VISTA rules are still the best way if you want to exclude multiple IP addresses belonging to your internal traffic.

Length of a visit in SiteCatalyst

Thought of sharing 2 really basic Visits related bits, when I asked people, not many knew.

1. We all know that a visit is 30 minutes of inactivity, but did you know that maximum length of a visit is 12 hours. This means if you keep browsing 24 hours on your site, without any 30 minutes inactivity, starting 00:01 till 23:59, there will be 2 visits.

2. One more, how SiteCatalyst calculates visits that span over 2 calendar dates? Does it deal with these in the same way as Daily visitors? For instance if you start your visit at 22:00 last night and continued to work for 6 hours, without any 30 minutes inactivity? Will that be 1 visit for yesterday and another for today? What if you access report for just today?
Answer is SiteCatalyst attributes a visit only to the day when it started. So in above example, visit will be counted for yesterday but never for today, even if you are accessing report just for today.
This is different from Daily Visitors where this visitor will be counted once for yesterday's report and again for today's report (depending upon persintent cookies are allowed on the machine)

Wednesday 15 September 2010

Site wide bounce rate in Site-Catalyst

If asked what’s our site’s bounce rate, it becomes a little tricky how to get all single page access visits and entry visits? We surely can calculate this but is there any simpler and quicker way?

Yes, this can be done in a very easier way by looking at “Visits of 1 page” in Path-length report as given below.